
On January 28, Microsoft reported a quarter that most companies would celebrate. Revenue of $81.3 billion, up 17% year-over-year. Non-GAAP earnings per share of $4.14 against a consensus of $3.97. Microsoft Cloud crossing $50 billion in a single quarter for the first time. Commercial remaining performance obligations — essentially contracted future revenue — more than doubled year-over-year to $625 billion, buoyed in part by large Azure and OpenAI commitments.
The stock fell nearly 10% the next day, erasing roughly $350 billion in market capitalization in what became Microsoft’s worst single-session drop since the early pandemic months of 2020. The contradiction tells you everything about where the company stands heading into its fiscal third-quarter report, expected around April 29.
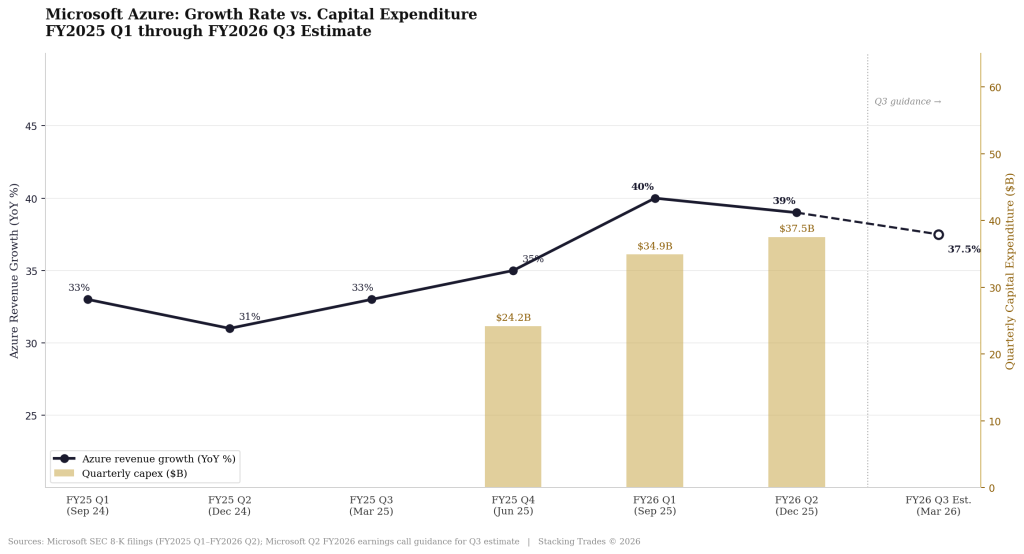
What the market heard was not the headline beat. It heard two things: Azure growth decelerated from 40% to 39% — the second consecutive quarter of softening — and capital expenditures hit $37.5 billion for the quarter alone, a 66% jump year-over-year and $3.2 billion above what analysts had modeled. First-half fiscal 2026 capex totaled $72.4 billion. The full-year trajectory now points toward $146 billion or higher.
The Infrastructure Wall Problem
Microsoft’s defense of the spending is not unconvincing. CFO Amy Hood told analysts on the earnings call that demand continues to outstrip available supply, and that capacity constraints are expected to persist at least through the end of the fiscal year in June. If Hood is right — that Azure would have grown well above 39% had Microsoft been able to allocate all its new GPU capacity exclusively to Azure — the deceleration is a supply story, not a demand story. That framing, if confirmed, is worth something to long-term holders.
The problem is the gap between that narrative and what investors can actually verify in a quarterly filing. Supply constraints do not appear on an income statement. What does appear is a cloud gross margin that has now compressed to roughly 65%, below the year-ago figure, as the infrastructure build absorbs cost before it absorbs revenue. CEO Satya Nadella framed capital expenditures as functioning partly like R&D — a long-duration investment in future capacity — but that framing requires a long patience horizon that equity markets often refuse to grant at a 30x-plus forward earnings multiple.
“Capex is growing faster than we expected, and maybe Azure is growing a little bit slower than we expected.”
— Analyst quoted in Fortune, citing the post-earnings institutional sentiment, January 29, 2026
The Copilot Adoption Gap
Microsoft’s AI monetization thesis rests heavily on Copilot — the AI add-on layered across Microsoft 365, GitHub, Teams, Azure, and an expanding range of vertical products. The Q2 numbers showed real momentum in seat count: 15 million paid Microsoft 365 Copilot seats, up 160% year-over-year, with GitHub Copilot at 4.7 million paid subscribers.
What the seat count does not show is how many of those seats are being actively used, or whether the per-seat economics justify the infrastructure underneath them. An independent survey by Recon Analytics covering over 150,000 enterprise users in January 2026 found that when employees had access to Copilot alongside ChatGPT and Google Gemini simultaneously, Copilot’s preferred-tool share was 8%. The same survey found that Copilot’s U.S. paid subscriber market share contracted 39% between July 2025 and January 2026. Microsoft has not disputed these figures publicly but has argued that its vertical Copilot products — Dragon Copilot in healthcare, Security Copilot in enterprise IT — are showing stronger adoption than the general-purpose Microsoft 365 product. That may be true, but the monetization math still depends on broad horizontal adoption to justify the infrastructure run rate.
Barclays managing director Raimo Lenschow put the investor concern plainly: the product designed to translate AI infrastructure into per-seat revenue for the average knowledge worker is losing share. The fallback position — AI-as-infrastructure, where the value shows up in Azure consumption rather than Copilot seats — is real, but it changes the unit economics story that Microsoft spent much of 2024 and 2025 selling to the market.
What the Q3 Print Needs to Show
Microsoft’s fiscal Q3 ends March 31, 2026. The company guided Azure growth of 37% to 38% in constant currency for the quarter — a range that is deliberately in line with analyst consensus rather than above it, which is itself a change in posture from quarters past when Microsoft consistently guided conservatively and beat by a meaningful margin.
Q3 operating margin guidance came in at 45.1%, below the 45.5% consensus, reflecting continued AI infrastructure pressure. The table below maps out what investors will be scoring the April 29 report against.
Metric
Q2 FY2026 Actual
Q3 FY2026 Guidance / Consensus
Signal
Azure growth (constant currency)
39%
37%–38%
Third consecutive quarter of deceleration if guidance is the floor
Total revenue
$81.3B (+17% YoY)
$80.65B–$81.75B
Guidance midpoint meets consensus; beat required to move stock
Operating margin
~47% (non-GAAP)
~45.1% guided
Compression expected; magnitude is the question
Capex
$37.5B (Q2); $72.4B H1 total
Sequential decrease guided by Hood
Any sequential decline would be the first in three quarters
M365 Copilot paid seats
15 million
No formal guidance; market watching
Acceleration needed to support monetization thesis
Cloud gross margin
~65%
~65% guided
Flat to Q2; any improvement would be read positively
The Stock Has Already Done a Lot of Work
Microsoft shares are down roughly 25% in the first quarter of 2026, the steepest quarterly decline in nearly two decades. The forward P/E has compressed to below 20 times earnings — the lowest multiple since 2016 and, briefly, below the S&P 500 average. That repricing has already absorbed a significant portion of the bad news embedded in the current narrative. Analyst consensus price targets remain in the $590–$622 range, implying substantial upside from current levels. The bull case has not changed: Azure has a $625 billion contracted backlog, 65% of Fortune 500 companies use Azure’s OpenAI services, and Microsoft’s enterprise distribution moat means it rarely has to win a new customer from scratch to grow.
The bear case is not that Microsoft fails. It is that the company spends $150 billion-plus annually on infrastructure for two to three years while Copilot monetization and Azure growth drift below the pace required to sustain premium valuation recovery. That is a patience and multiple question, not a solvency question. But for investors managing concentrated positions or considering entry points, the late-April print is the first moment this fiscal year where the data either validates or challenges the supply-constraint defense that management has leaned on since January.
One Risk That Gets Underpriced
The OpenAI dependency is structural in a way the quarterly filings do not fully capture. Microsoft’s $7.6 billion in net gains from OpenAI investments boosted GAAP net income by $1.02 per share in Q2 — a number that was larger than the difference between GAAP and non-GAAP EPS. Strip that out and the headline numbers look different. More importantly, a meaningful share of the $625 billion commercial backlog is tied to Azure commitments driven by OpenAI’s own consumption and its ecosystem. If OpenAI’s commercialization slows, Microsoft’s cloud growth trajectory becomes harder to sustain. That risk is real and not fully priced by analysts who treat the OpenAI relationship as a durable asset rather than a concentrated single-entity dependency.
WHAT TO WATCH NEXT
- The April 28–29 fiscal Q3 print: Azure growth direction (whether it holds at 37–38% or surprises in either direction) and capex sequential change are the two numbers that will set the tone for the rest of 2026.
- Microsoft’s Build developer conference in May — traditionally the venue for major Copilot and Azure announcements. Any new monetization tier, agent pricing model, or enterprise contract structure could shift the narrative meaningfully.
- M365 price increases take effect July 1, 2026. The revenue impact will not show in Q3 results, but management commentary on enterprise renewal behavior leading into the increase will be closely watched.
- Google Cloud’s Q1 2026 results, expected around the same time — Google Cloud grew 48% year-over-year in the most recent quarter, outpacing Azure. If that gap widens, the competitive displacement thesis gains traction among institutional investors.
- Any revision to full-year capex guidance. Hood signaled sequential decrease in Q3, but the full fiscal year trajectory toward $146 billion has not been formally updated. Any change to that forward commitment will move the stock.