
Walmart has spent two years telling investors that its technology investments would eventually show up in the margin line. The Q1 FY2027 print, released May 21, was the most specific evidence yet that it is starting to happen — and the Q2 report, scheduled for August 20, will be the next real test of whether the pattern holds.
The headline numbers from Q1 were solid but unspectacular: revenue of $177.8 billion, up 7.3%, and adjusted operating income growth of roughly 5% in constant currency. What was harder to see in the top-line figures was a structural shift in where Walmart’s profits are actually coming from — and what that shift implies about the return on the company’s AI and automation build-out.
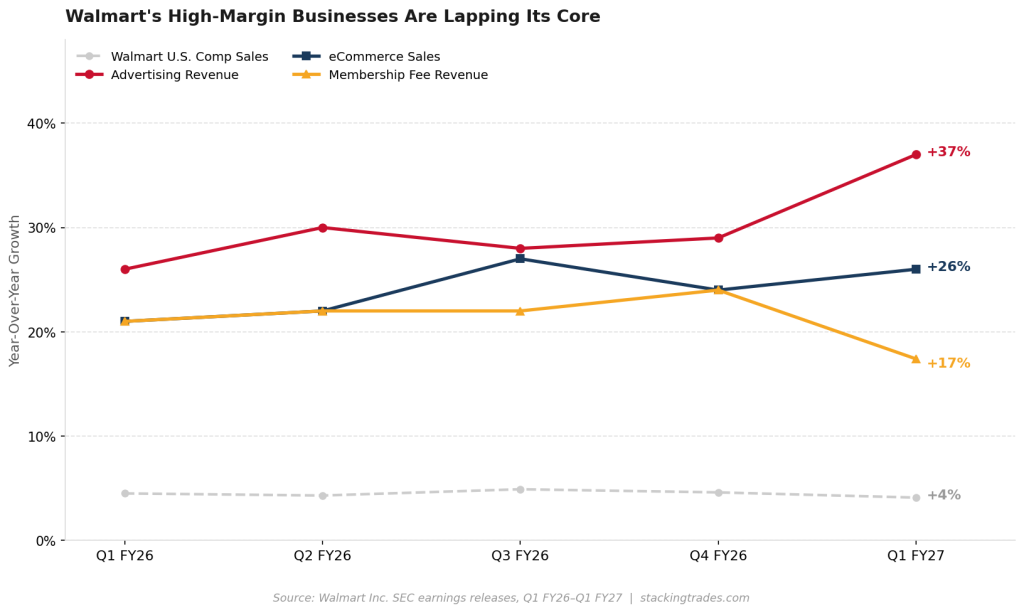
The High-Margin Layer Is Growing Faster Than the Core
Advertising revenue at Walmart U.S. grew 36% in Q1, with the Walmart Connect platform up 44% excluding the VIZIO integration. Membership fee revenue grew 17.4% globally, with U.S. Walmart+ fee revenue hitting a record for a fiscal first quarter. Marketplace net sales in the U.S. grew nearly 50%. Taken together, advertising and membership fees now account for roughly one-third of consolidated operating income — a figure that would have been difficult to model five years ago for a company whose identity was built on low-margin grocery volume.
The connection to AI and automation is not incidental. Walmart’s advertising business runs on data — specifically, its ability to close the loop between a digital ad impression and a physical or online purchase at a scale that Google and Meta cannot replicate with their own retail infrastructure. The more automation improves inventory visibility and order accuracy, the more valuable the first-party data becomes, and the more advertisers will pay for placement inside the Walmart ecosystem.
Automation Is Hitting the Numbers Rainey Promised
CFO John David Rainey said on the Q4 FY2026 earnings call that technology-enabled productivity benefits are critical to the company’s ability to grow its core business at lower marginal cost. The Q1 data shows that thesis is tracking, even against a $175 million fuel cost headwind that knocked roughly 250 basis points off operating income growth.
“Our teams are adopting innovative technologies, driving productivity through automation and growing higher-margin commerce solutions.”
— John Furner, President and CEO, Walmart Inc., Q1 FY2027 Earnings Release, May 21, 2026
About 60% of Walmart U.S. stores are now receiving freight from automated distribution centers, and roughly half of the company’s e-commerce fulfillment center volume is automated. Twenty-three of the company’s 42 regional distribution centers in the U.S. are being retrofitted. Walmart has described this two-year window as the peak of its annual capital spending on supply chain automation and store remodels. The expected return on that peak is operating income growing faster than sales — which Q1 delivered, even masked by fuel costs, and which Q2 guidance implies more explicitly: operating income growth of 7% to 10% against net sales growth of 4% to 5%.
The Metric Investors Should Be Watching in August
The Q2 guidance range — operating income growth of 7% to 10% against net sales growth of 4% to 5% in constant currency — is the clearest single number Walmart has given for whether the AI-driven model is generating return at scale. Adjusted EPS guidance of $0.72 to $0.74 implies the company expects to deliver operating leverage even as fuel costs are expected to remain elevated. Rainey said on the Q1 call that the Q2 operating income guidance is the best the company has given in a decade and a half.
The cleanest test will come from two specific lines in the August 20 print: gross profit rate direction and the advertising revenue growth number. Gross profit rate improved 6 basis points in Q1, aided by merchandise mix and the continued shift toward higher-margin categories and business lines. If that improvement holds or accelerates into Q2, it confirms that the mix shift is durable, not a one-quarter feature of favorable category trends. If advertising growth holds near 30% or above for the third straight quarter, it validates that the data infrastructure underlying the ad business is compounding, not plateauing.
What AI Investment Looks Like in Practice at This Scale
Walmart’s AI deployment is not a single product or a pilot program — it is woven into the operating model across three distinct functions. The first is supply chain: automated distribution centers reduce labor intensity in freight processing and improve inventory accuracy, which Furner noted has measurably reduced markdowns. The second is merchandising: the Wally AI agent assists buyers with out-of-stock and overstock root-cause analysis, reducing reactive ordering decisions that erode margin. The third is customer-facing revenue: Sparky, the AI assistant in the Walmart app, drives engagement that flows through to advertising and Walmart+ membership conversion.
This is distinct from the enterprise software AI story — the one playing out at Salesforce and ServiceNow, where companies are selling AI access on top of existing SaaS contracts. Walmart’s AI investment is embedded in the cost and revenue structure of the world’s largest retailer, and its returns are measured in basis points on a $177 billion quarterly revenue base, not in software ARR. That makes the numbers harder to isolate and easier for the market to miss — which is precisely why the August print deserves closer attention than it usually gets from investors whose Walmart position is a defensive allocation.
The question the Q2 print will answer is whether the operating leverage story Walmart has been building toward is arriving on the timeline its capex implied — or whether fuel, labor cost inflation, and tariff-related uncertainty are compressing the window. Based on the Q1 read-through and the guidance Rainey put on record, Walmart’s management believes the window is open. The tariff environment adds an additional test for any retailer with a global supply chain, but Walmart’s pricing power and supplier relationships give it more room to absorb or pass through cost changes than most competitors at its scale.
What to Watch Next
- Walmart Q2 FY2027 results, August 20 — the operating income growth number against the 7%–10% guided range is the primary test. Any delivery at the top of that range would be the strongest evidence yet that the automation-and-mix model is compounding. A miss below 7% would force a re-examination of whether fuel costs and tariff pressure are structural headwinds, not temporary ones.
- Advertising revenue growth rate in Q2. At 37% globally in Q1, the business is the fastest-growing major segment Walmart operates. Watch for whether growth continues above 30% or begins to moderate as the base of comparison expands. Deceleration below 25% would signal the easy gains from audience scaling are behind them and the harder work of monetization efficiency is ahead.
- Gross profit rate in Q2. A second consecutive quarter of year-over-year improvement in gross profit rate, driven by merchandise mix, would be one of the more durable signals that the technology-enabled shift toward higher-margin categories is taking hold at the unit level, not just in the consolidated income statement.
- Walmart+ net add disclosure. Membership fee revenue grew double digits in Q1, setting a record for the quarter. Whether the absolute subscriber count is growing or whether revenue growth is being driven primarily by price and mix will clarify how much runway remains before the membership business requires a structural change.
- Capital expenditure guidance revision. Walmart has guided capex at approximately 3.5% of net sales for FY2027, describing this as the peak spending window. Any update to that guidance — upward or downward — would reset the model for when operating cash flow begins to recover materially from the current investment cycle’s peak.